As consumers have adapted to life under COVID-19, we decided to analyze shoppers using two representative retail apps to gauge the impact of COVID-19 over time – and to see if consumer behavior under COVID could enlighten how you craft your go-forward strategy.
We chose to analyze customers of two essential retailers who offered both offline and online services during the pandemic to get a more holistic view of consumer behavior: Lowe’s, the nation’s #2 home improvement chain, and Best Buy, the $43 billion consumer electronics giant.
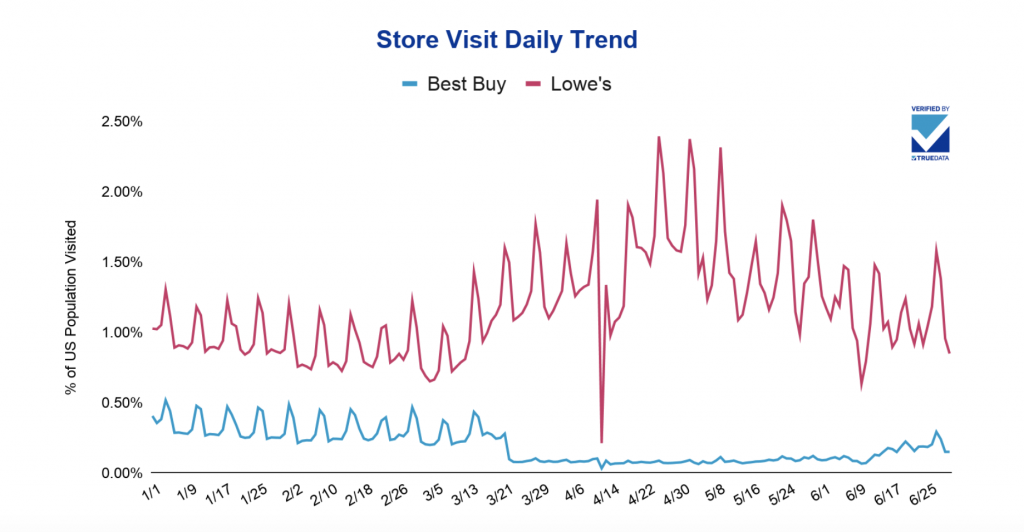
Shoppers’ foot traffic to both retailers was affected by the pandemic and saw a significant drop after Feb. 25 as the outbreak accelerated. However, store visits to Lowe’s rebounded quickly entering March, and in fact, surpassed its pre-lockdown level, as people quickly realized that they needed to buy home essentials and invest in their homes if they were going to be spending more time there. This finding is supported by Lowe’s Q1 report which noted increased sales in paint, lawn & garden, lumber, hardware, tools, and appliances. Lowe’s store visits reached an apex on April 25 (Saturday) as nearly 2.5% of the US population shopped there. Lowe’s became the winner in the pandemic with growth in both offline and online businesses.

However, store traffic at Lowe’s has experienced some ups and downs since May and it remains to be seen whether Lowe’s can sustain its growth going forward.
The situation at Best Buy was different. Even though designated an essential retailer, Best Buy opted to limit store access and stick to curbside pickup starting March 23, as captured by the visit trend above. After that, store traffic at Best Buy remained low until 800 locations began inviting shoppers back in mid-June. However, strong demand for computing (due to work at home requirements) and gaming (due to shelter-in-place rules) drove a 155.4% increase in Best Buy’s Q1 online revenue.
The question for Best Buy: how to capture more online and offline traffic to be a bigger retail winner?
Our analysis shows that despite surges or dips in foot traffic during the pandemic, shoppers still prefer to visit retailers on weekends, with Saturdays being slightly higher than Sundays. And what about that big drop on April 12? That’s when both stores were closed for the Easter holiday.
How does shopper behavior differ based on city and state? The data below shows that consumers in California have a proportionately higher demand for essentials or they just go out more often for shopping. It shows that, while 11.47% of Lowe’s store visits took place in California, only 6.37% of Lowe’s stores are in that state. Similarly, there is a higher percentage of Best Buy shoppers (17.64%) in California, even though the state represents just 14.5% of stores.

By looking at other retailers that shoppers have visited, you can discover more about your target consumers. For example, a sizable percentage of Lowe’s and Best Buy customers visit the Home Depot, Lowe’s rival. Best Buy shoppers are more likely than Lowe’s customers to visit Target and Dick’s Sporting Goods, while Lowe’s customers prefer the deals at Dollar General. When retailers understand customers’ needs and purchasing habits, they gain the first-hand insights they need to better test high-performance behavioral audiences.

A more nuanced portrait of these shoppers begins to emerge as we look at their patronage of quick-serve restaurants (QSR). It shows a higher percentage of Best Buy customers also visit Starbucks, suggesting, for example, that a cross-promotion between the two companies could be more fruitful than a Lowe’s/Starbucks partnership.

Store visitation is, of course, important, but represents only one offline metric. When we also factor in mobile behavioral metrics, such as app install data, we gain a richer understanding of Lowe’s and Best Buy’s customers. As the data below reveals, a higher percentage of Best Buy store visitors have the retailer’s app downloaded on their devices than Lowe’s store visitors. Best Buy may be in a better position to strengthen customer relationships and drive more omnichannel revenue. When we take this footfall data and cross-index against the other retailer apps used by these consumers, we can fuel actionable competitive intelligence and uncover opportunities for conquesting.
And finally, when we compare demographic metrics, we see that Best Buy store shoppers are more male, skew younger, and include more Spanish speakers.


Bottom line? With our highly accurate store visitation data matched to other deterministic data attributes, you can know more about your customers and personalize your communication. You can grow market share by conquesting your competitors’ customers. And you can predict who is more likely to visit your store or download your app (see the Dunkin Donuts case study). Get a demo to access the data and intelligence you need to better engage with your shoppers and drive new growth.


Subscribe For Updates